


Leaflet.js is an open-source JavaScript library for mobile-friendly interactive maps. It's lightweight, simple, and flexible, and is probably the most popular open-source mapping library at the moment.
Getting Started
- The latest stable Leaflet release is available on several CDN’s — to start using it straight away, place this inside the
headtag:
<link rel="stylesheet" href="https://unpkg.com/leaflet@1.7.1/dist/leaflet.css"
  integrity="sha512-xodZBNTC5n17Xt2atTPuE1HxjVMSvLVW9ocqUKLsCC5CXdbqCmblAshOMAS6/keqq/sMZMZ19scR4PsZChSR7A=="
  crossorigin=""/>

<script src="https://unpkg.com/leaflet@1.7.1/dist/leaflet.js"
  integrity="sha512-XQoYMqMTK8LvdxXYG3nZ448hOEQiglfqkJs1NOQV44cWnUrBc8PkAOcXy20w0vlaXaVUearIOBhiXZ5V3ynxwA=="
  crossorigin=""></script>
- To hold the map, we have to create a container element and define its dimensions:
<div id="my-map"></div>
#my-map {
    height: 500px;
}
Now, we’re ready to initialize the map and do some stuff with it.
Setting up the map
First, we'll initialize the map object using L.map(). It Instantiates a map object given the DOM ID of a container element and optionally an object literal with Map options.
L.map(<String> id, <Map options> options?)
Let's create a Map options object to pass inside L.map() and initialize the map object:
let mapOptions = {
    center: [19.076090, 72.877426],
    zoom: 12
};

let map = L.map('my-map', mapOptions);
center- pass aLatLngobject specifying the location where we want to center the map. Here, I have specified the coordinates for Mumbai, India.zoom- pass an integer representing the initial zoom level of the map.
Finally, we need to create a base layer of map tiles by instantiating the TileLayer class. While instantiating it you need to pass an URL template requesting the desired tile layer(map) from the service provider. Here, I have used openstreetmap.org.
let layer = new L.TileLayer(
  "http://{s}.tile.openstreetmap.org/{z}/{x}/{y}.png",
  {
    attribution:
      'Tiles by <a href="http://openstreetmap.org">openstreetmap.org</a>',
  }
);
map.addLayer(layer);
{z}/{x}/{y}is a template that Leaflet uses to find tiles at the correctzoom,x-coordinate, andy-coordinate.
Note: Attribution is obligatory as per the copyright notice.
So, this is how our map looks for now:
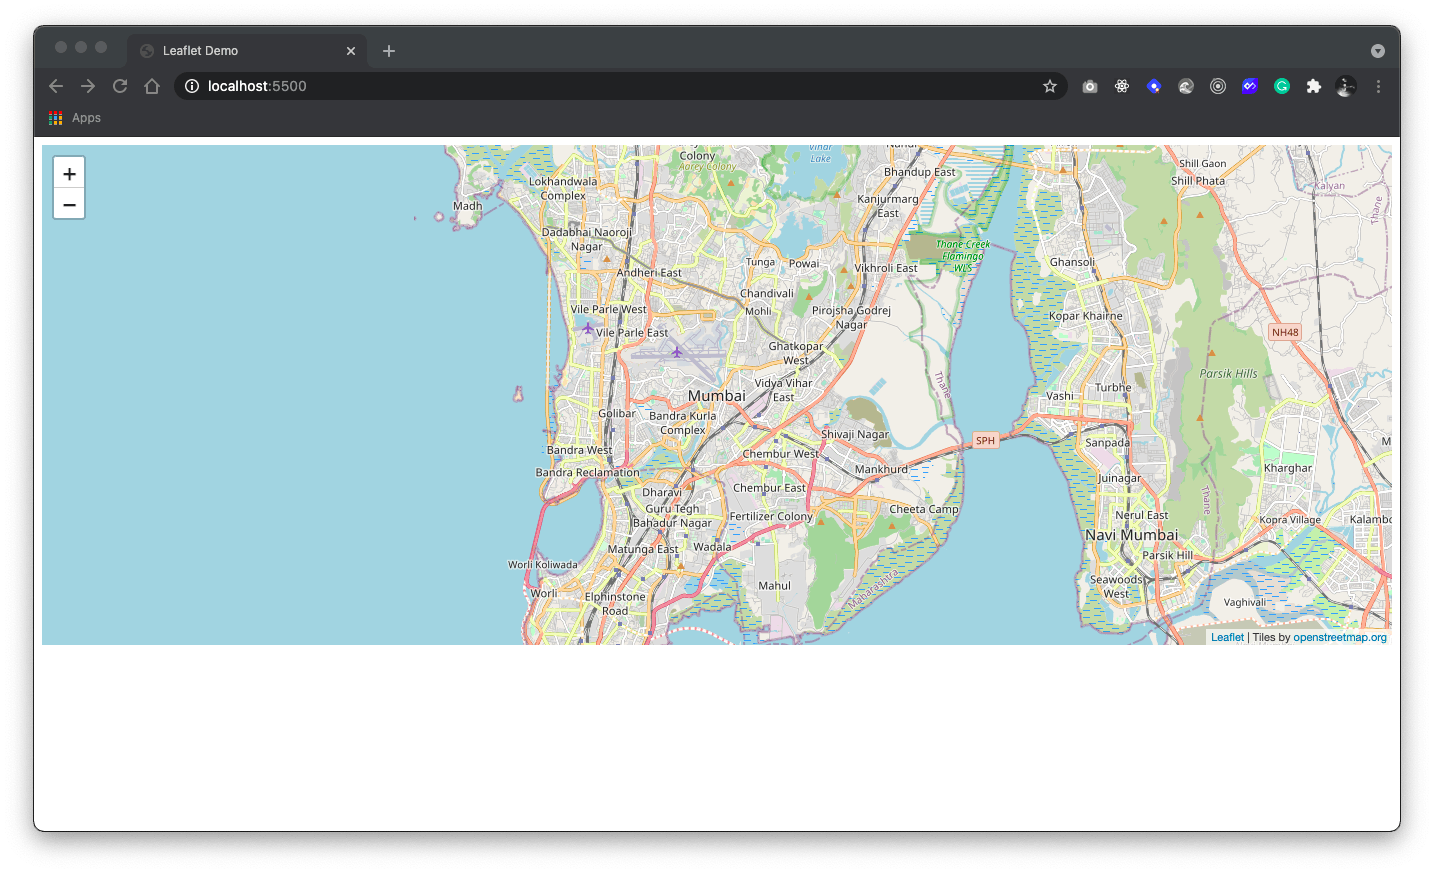
It’s worth noting that Leaflet is provider-agnostic, meaning that it doesn’t enforce a particular choice of providers for tiles. You can explore other service providers here.
Markers, circles and polygons
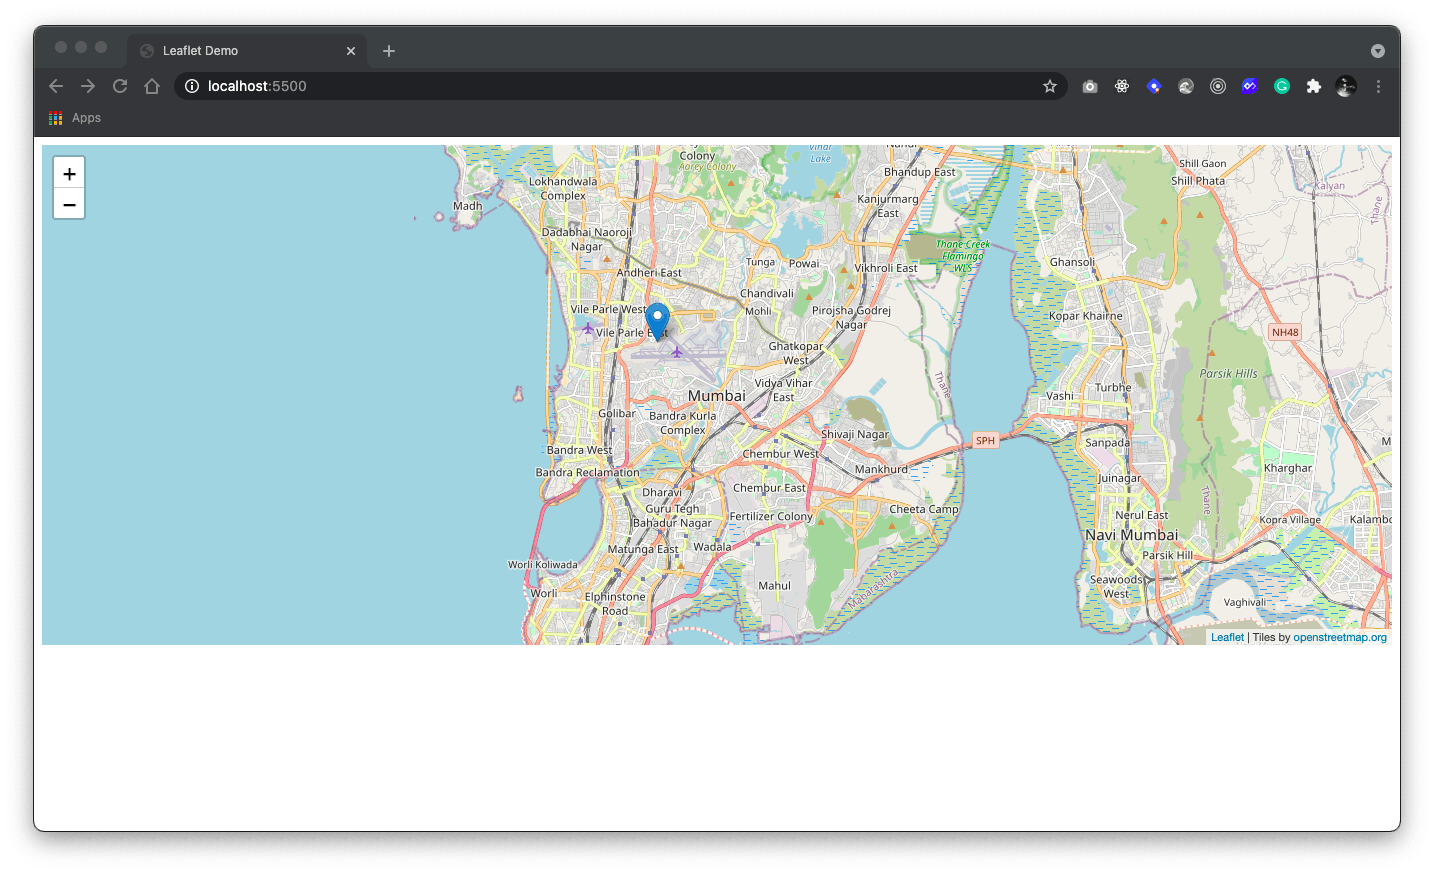
Besides tile layers, we can easily add other things to our map, including markers, polylines, polygons, circles, and popups. Let’s add a marker:
let marker = L.marker([19.0931, 72.8568]).addTo(map);
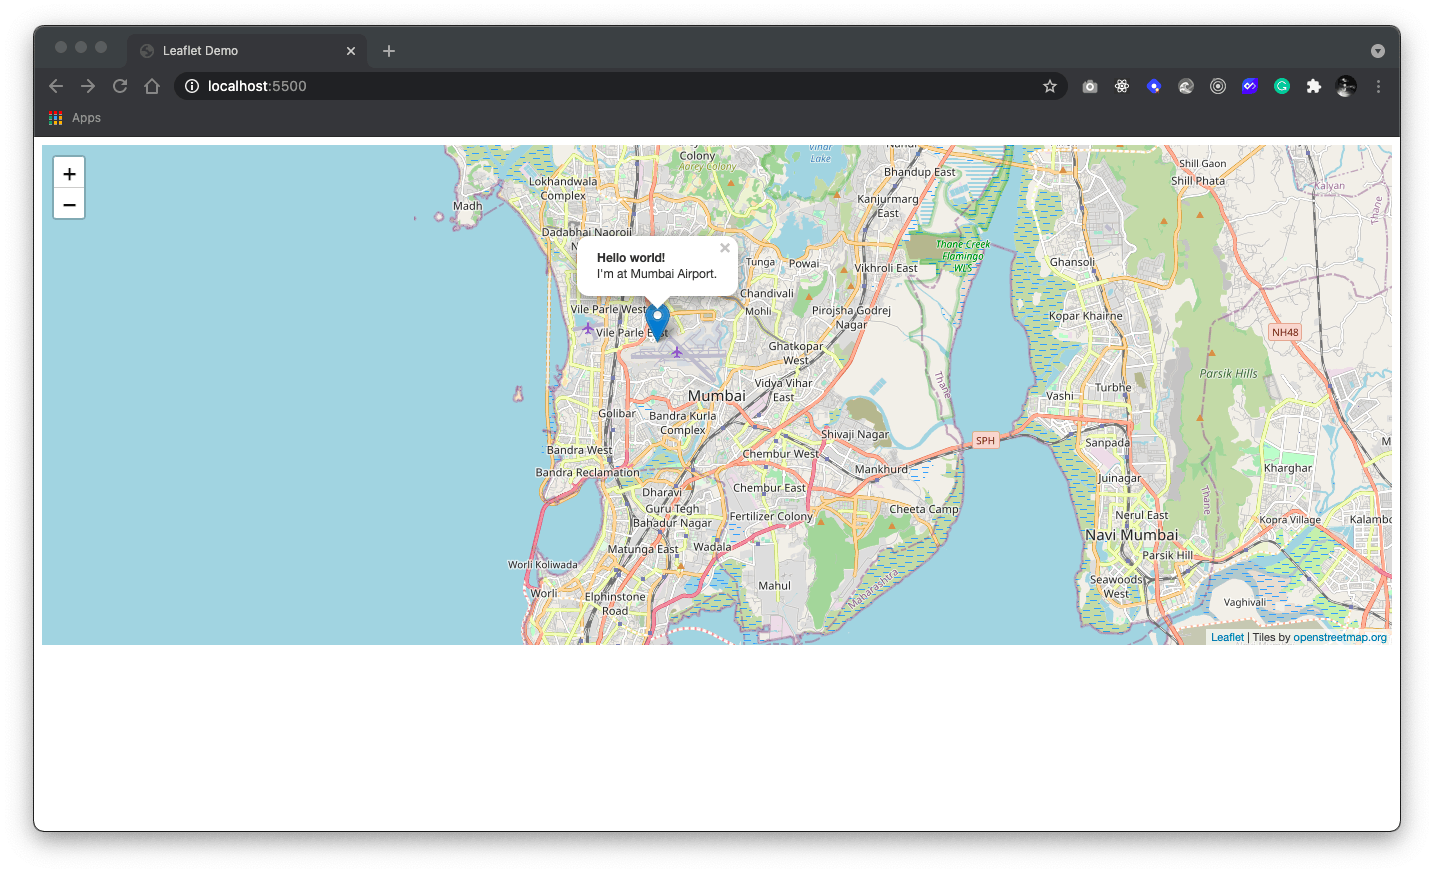
Now, let's add a popup for our marker:
marker.bindPopup("<b>Hello world!</b><br>I'm at Mumbai Airport.").openPopup();
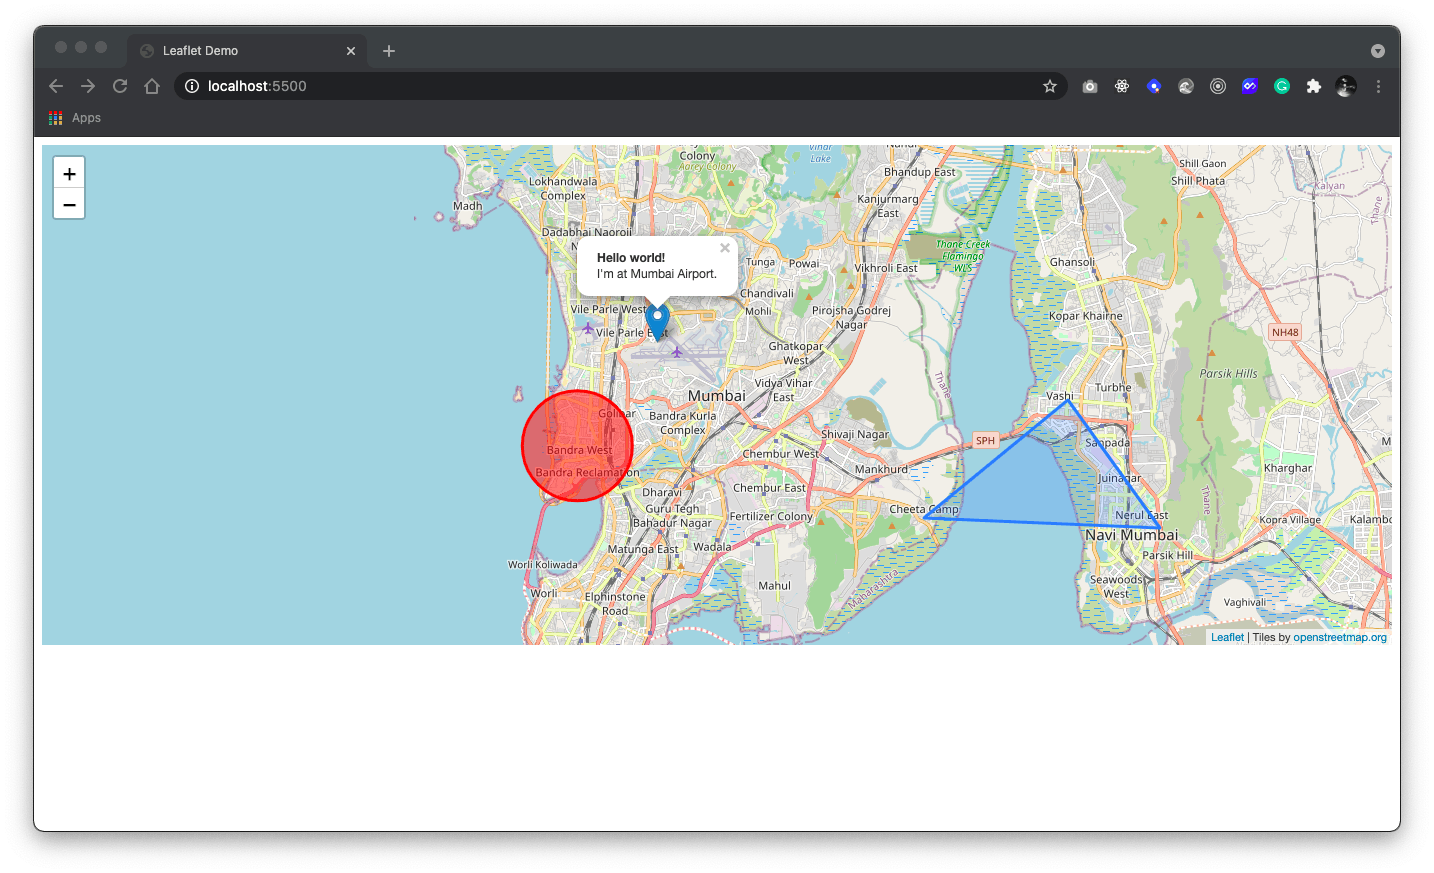
Adding a circle is the same (except for specifying the radius in meters as a second argument), but lets you control how it looks by passing options as the last argument when creating the object:
let circle = L.circle([19.0596, 72.8295], {
    color: 'red',
    fillColor: '#f03',
    fillOpacity: 0.5,
    radius: 2000
}).addTo(map);
While we're here, let's also add a polygon:
let polygon = L.polygon([
    [19.0330, 73.0297],
    [19.0745, 72.9978],
    [19.0361, 72.9486]
]).addTo(map);
Dealing with events
Every time something happens in Leaflet, e.g. user clicks inside the map, the corresponding object sends an event which you can subscribe to with a function. It allows you to react to user interaction. Let's demo this by implementing a functionality where if a user taps anywhere inside a map, a marker is created.
map.on("click", function(e){
    new L.Marker([e.latlng.lat, e.latlng.lng]).addTo(map);
 });
Conclusion
We'll leave it there for now. We've already gone from nothing to a somewhat fancy map, but there is much more you can do with Leaflet. Be sure to read the documentation to explore the possibilities.